2. Quick Start Guide
This Quick Start Guide uses the Self-consistent and Band Structure Calculation of Si Crystal Structure in the first-principles quantum transport calculation software Nanodcal as an example. It is divided into several steps, including logging in and starting Device Studio, creating a Device Studio project, importing the Si crystal structure, generating self-consistent and band structure calculation input files, submitting self-consistent and band structure calculation tasks, data visualization of the Si crystal structure band structure, and exporting band structure visualization results.
2.1. Login and Start Device Studio
Double-click the DeviceStudio.exe file in the bin directory of the extracted Device Studio installation package or the Device Studio shortcut on your desktop. The login and startup process is shown in fig. 2.1.
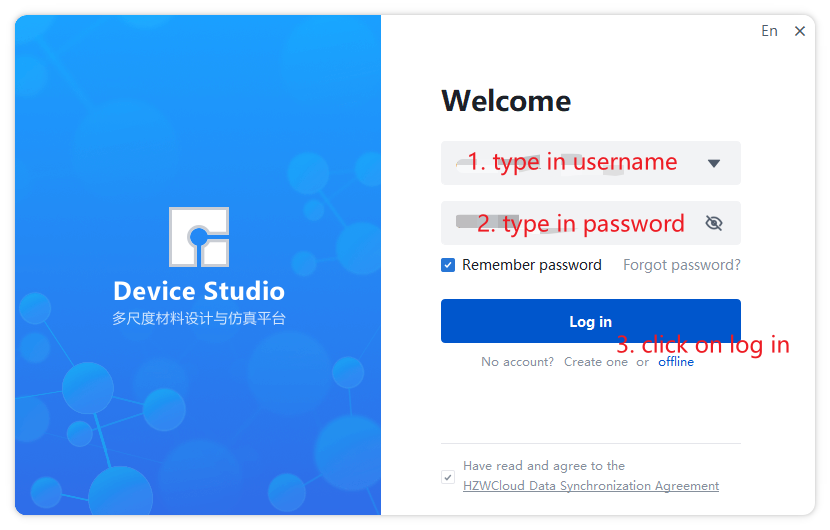
fig. 2.1 Login and Start Device Studio
After logging in and starting Device Studio, you can create a Device Studio project. The project creation process is shown in fig. 2.2, fig. 2.3, and fig. 2.4.
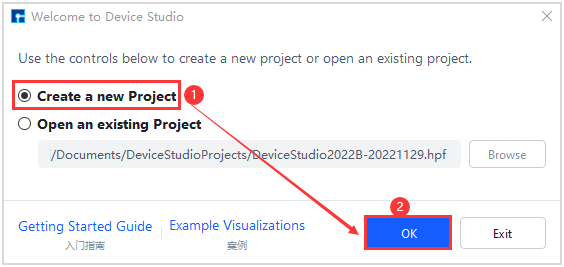
fig. 2.2 Create Project
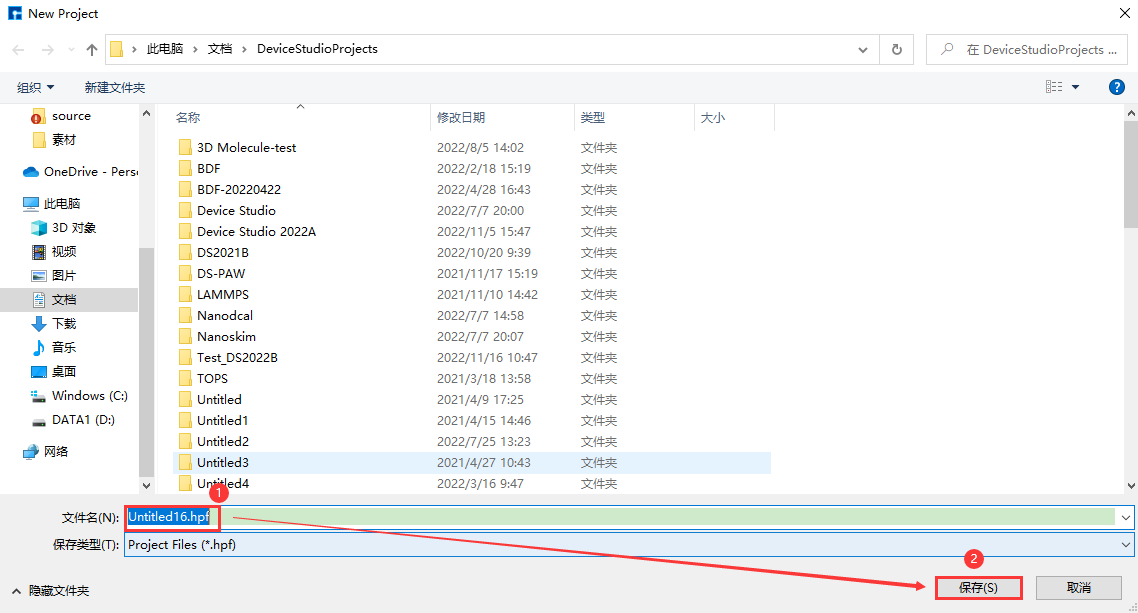
fig. 2.3 Name the Project
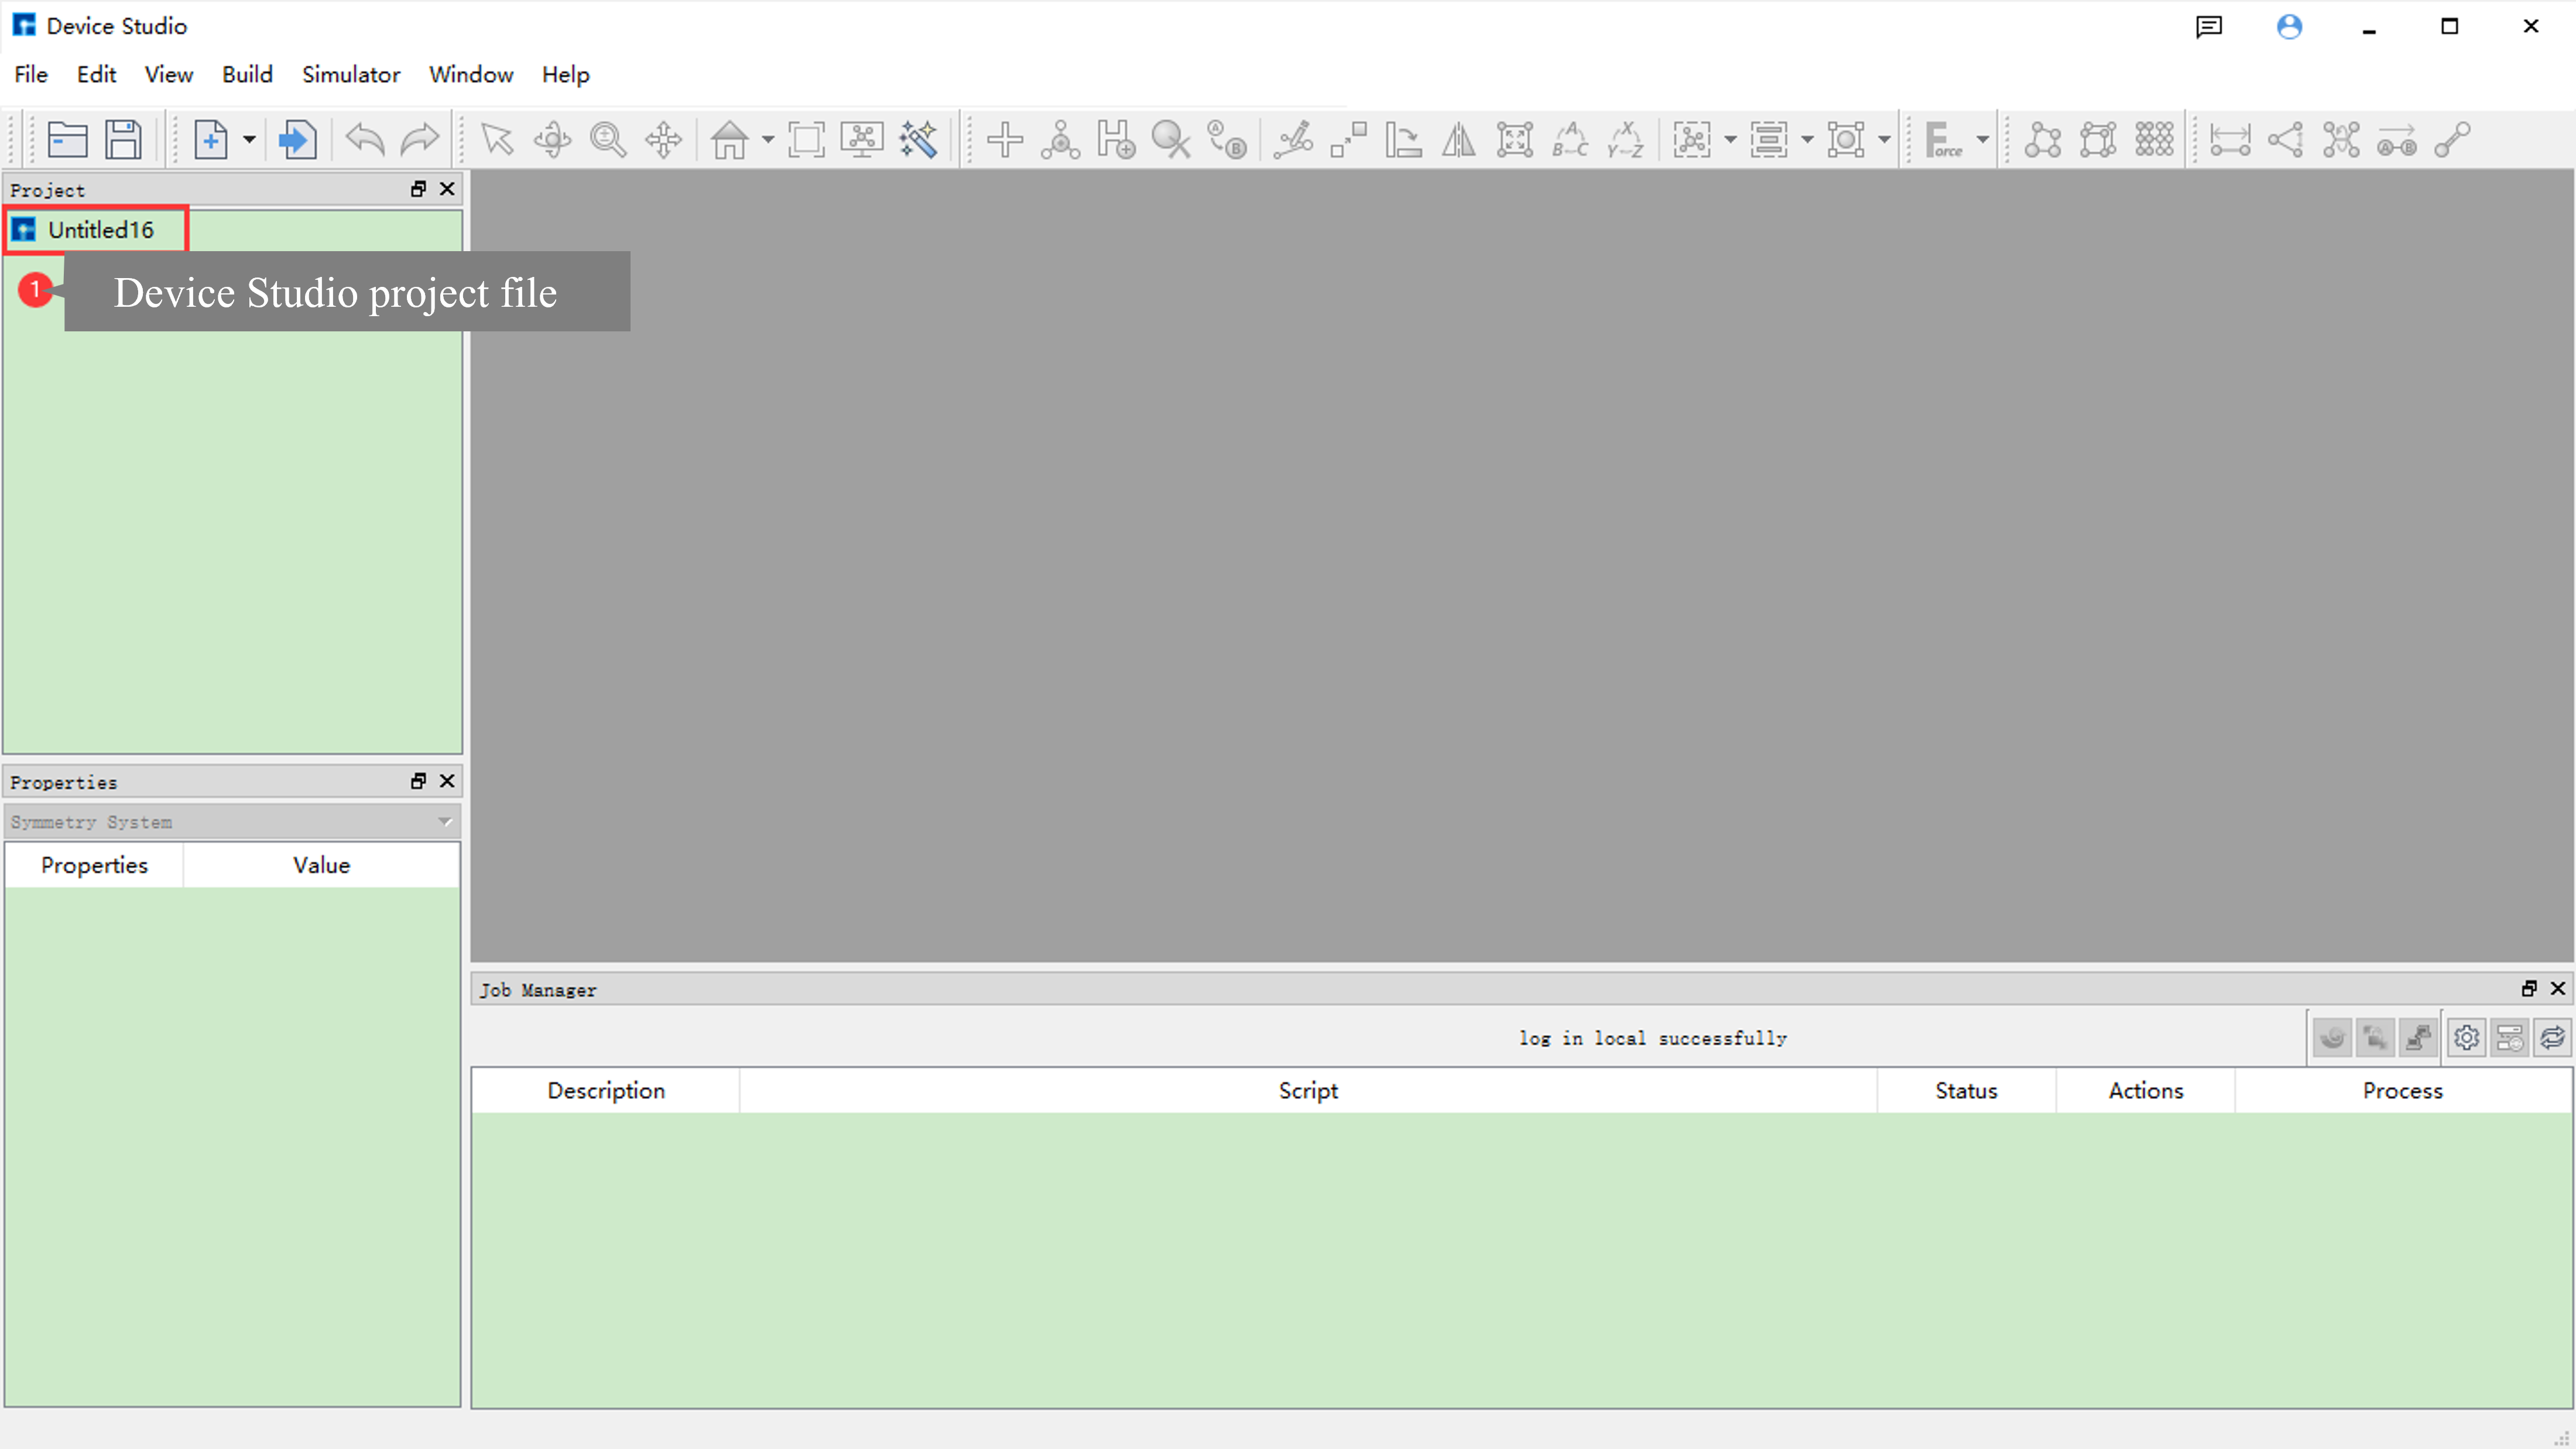
fig. 2.4 Device Studio Interface After Project Creation
The process of importing the Si crystal structure is shown in fig. 2.5, fig. 2.6, and fig. 2.7.
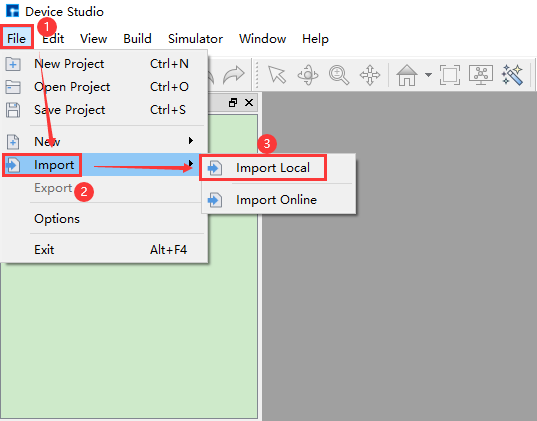
fig. 2.5 Open Import Structure Interface
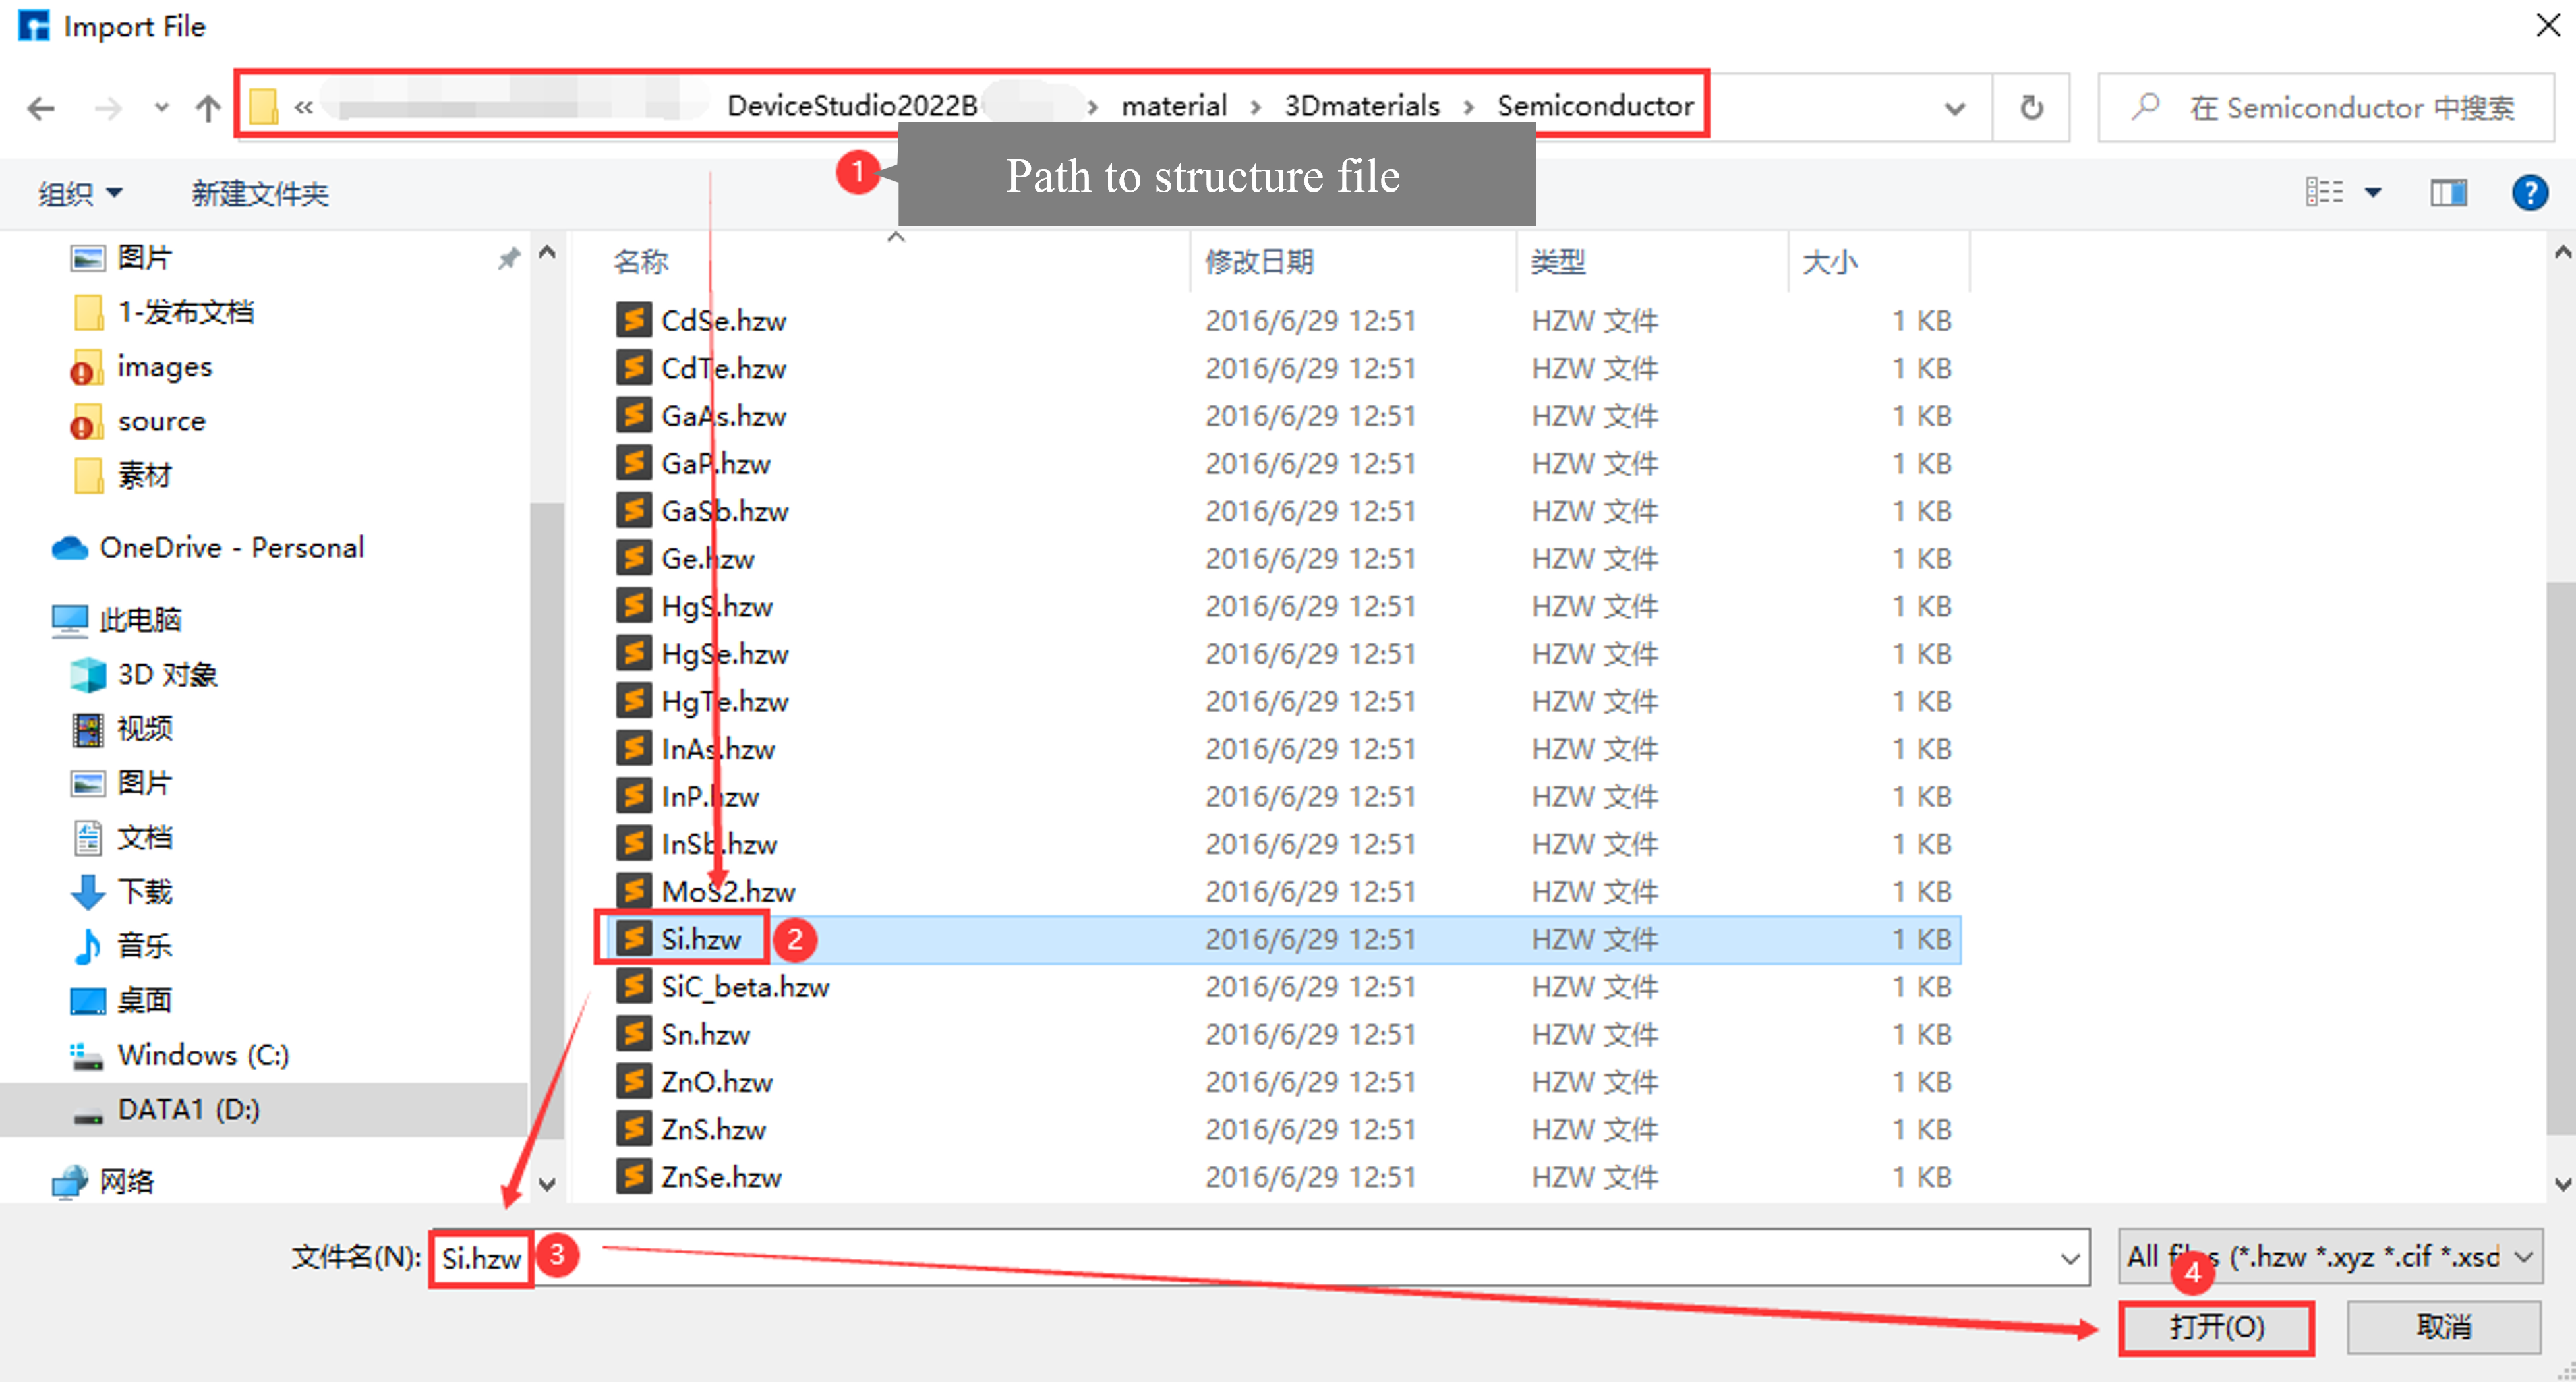
fig. 2.6 Import Si Crystal Structure
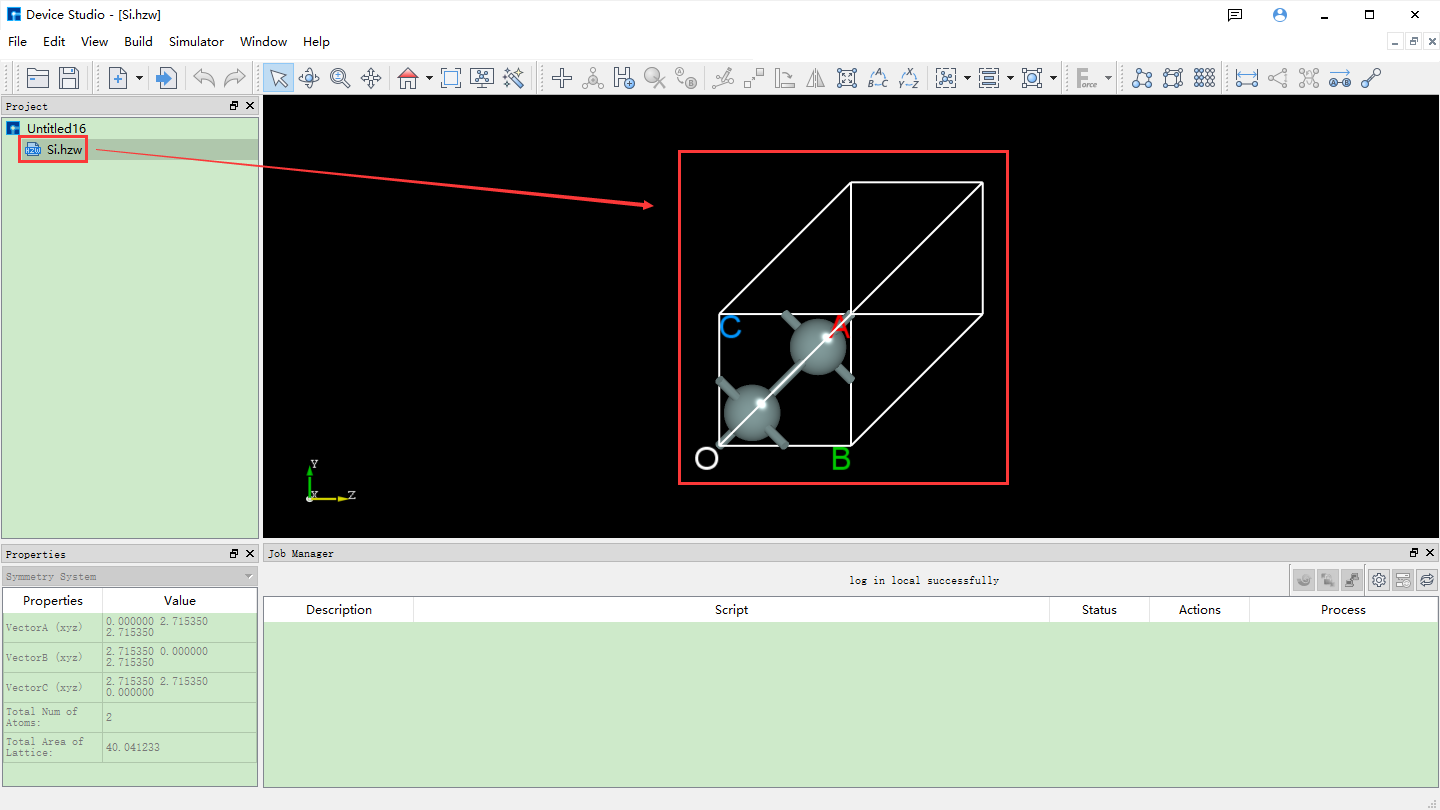
fig. 2.7 Device Studio Interface After Importing Si Crystal Structure
The process of generating the Si crystal structure self-consistent calculation input file is shown in fig. 2.8, fig. 2.9, and StartedGuide_10.
The process of generating the Si crystal structure band structure calculation input file is shown in StartedGuide_11, fig. 2.10, and fig. 2.11.
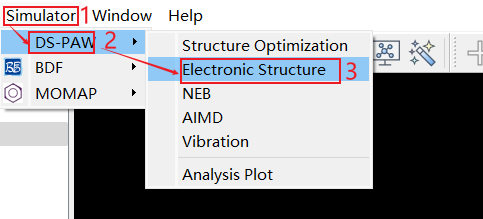
fig. 2.8 Open Generate Self-consistent Calculation Input File Interface
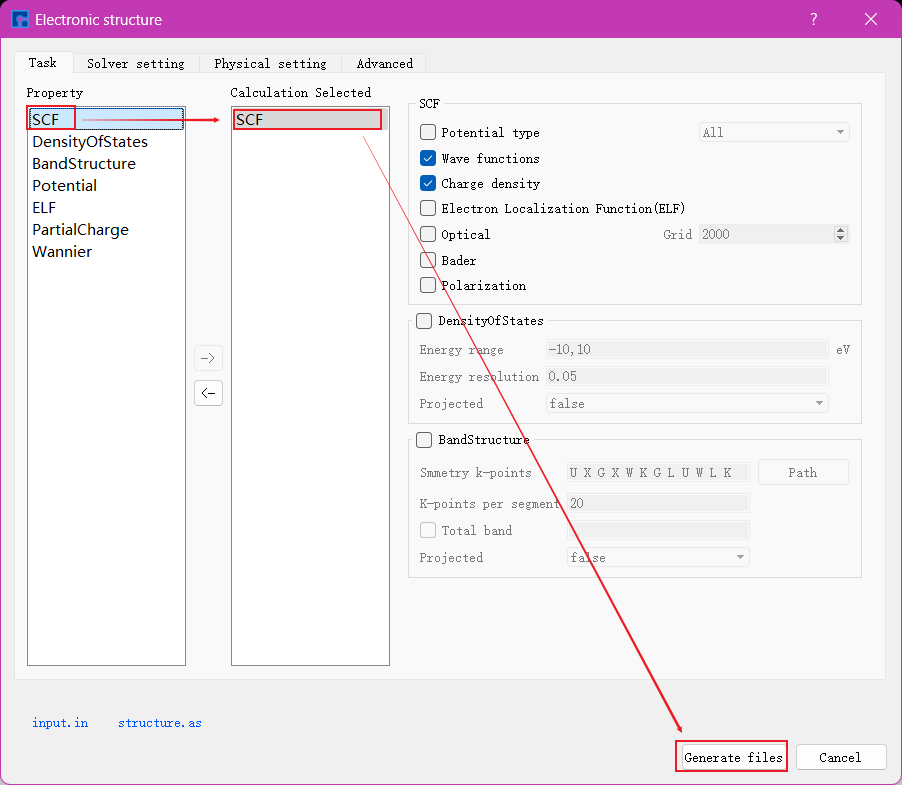
fig. 2.9 Set Parameters and Generate Self-consistent Calculation Input File
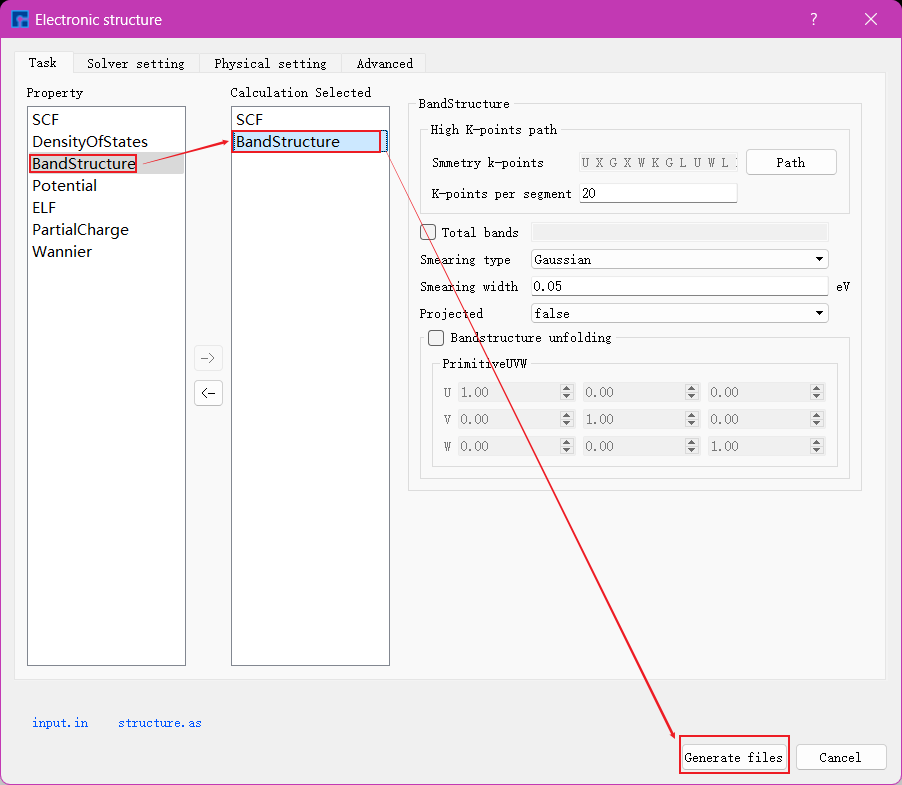
fig. 2.10 Set Parameters and Generate Band Structure Calculation Input File
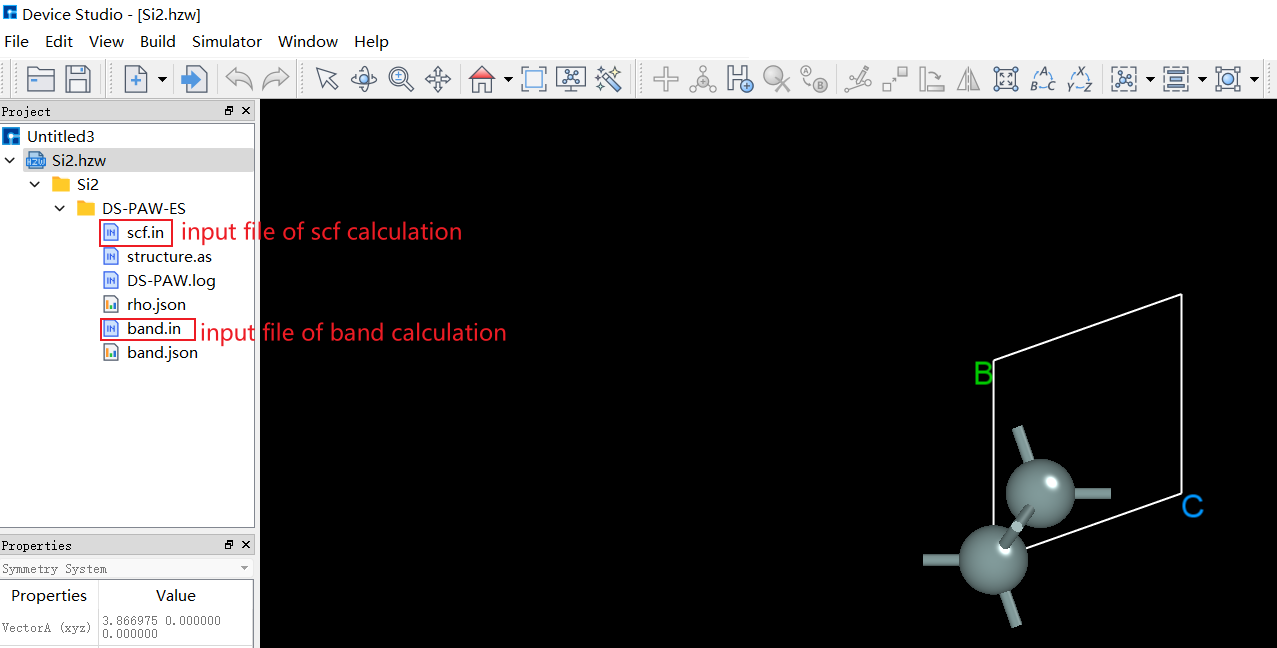
fig. 2.11 Device Studio Interface After Generating Band Structure Calculation Input File
First, perform the self-consistent calculation for the Si crystal structure. The process of submitting the Si crystal structure self-consistent calculation task is shown in fig. 2.12 and fig. 2.13.
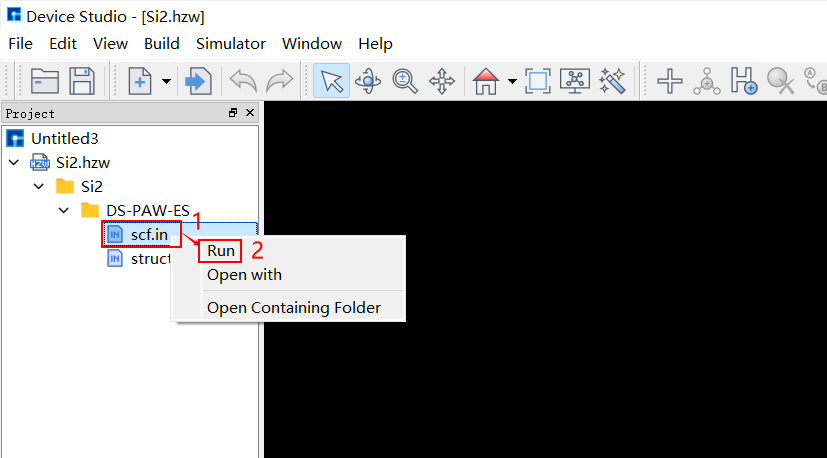
fig. 2.12 Submit Self-consistent Calculation Task Step 1
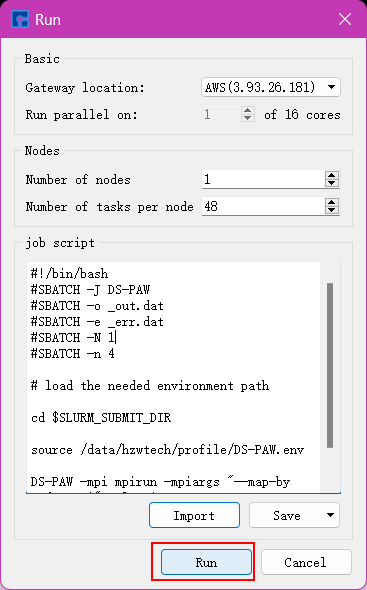
fig. 2.13 Submit Self-consistent Calculation Task Step 2
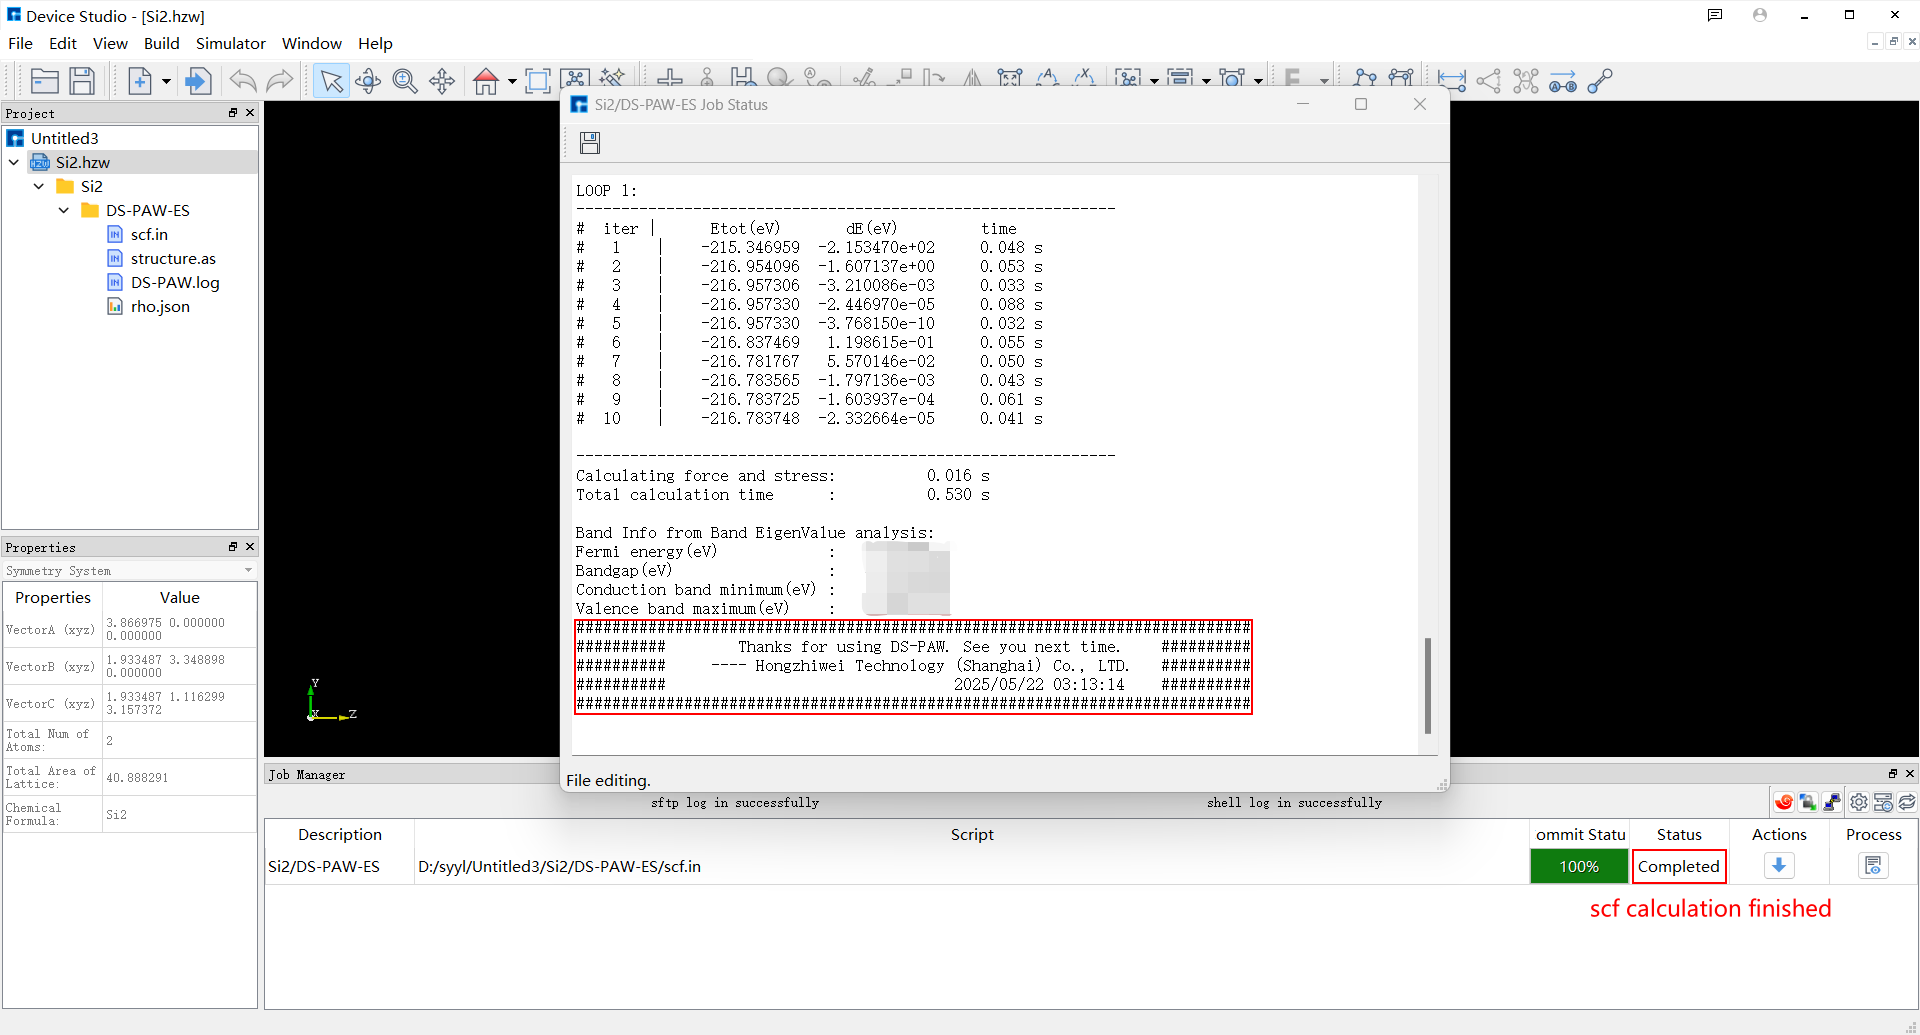
fig. 2.14 Device Studio Interface After Si Crystal Structure Self-consistent Calculation Completion
Only after the self-consistent calculation is completed can the band structure calculation of the Si crystal structure be performed. You can determine whether the self-consistent calculation task is completed through the Computation Task Monitoring Management Area. When the calculation task is queued, running, or completed, the Status will be Queued, Running, or Completed respectively. The Device Studio interface after the Si crystal structure self-consistent calculation is completed is shown in fig. 2.14. The process of submitting the Si crystal structure band structure calculation task is shown in fig. 2.15 and fig. 2.16. The Device Studio interface after the Si crystal structure band structure calculation is completed is shown in fig. 2.17.
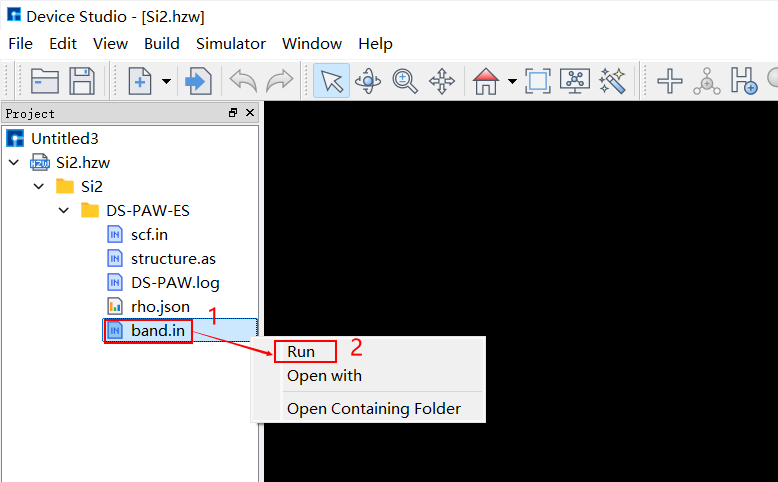
fig. 2.15 Submit Band Structure Calculation Task Step 1
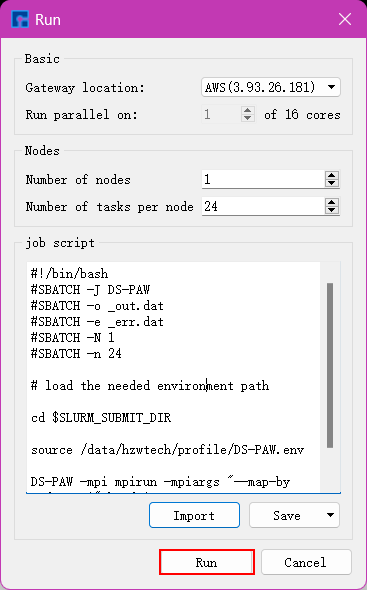
fig. 2.16 Submit Band Structure Calculation Task Step 2
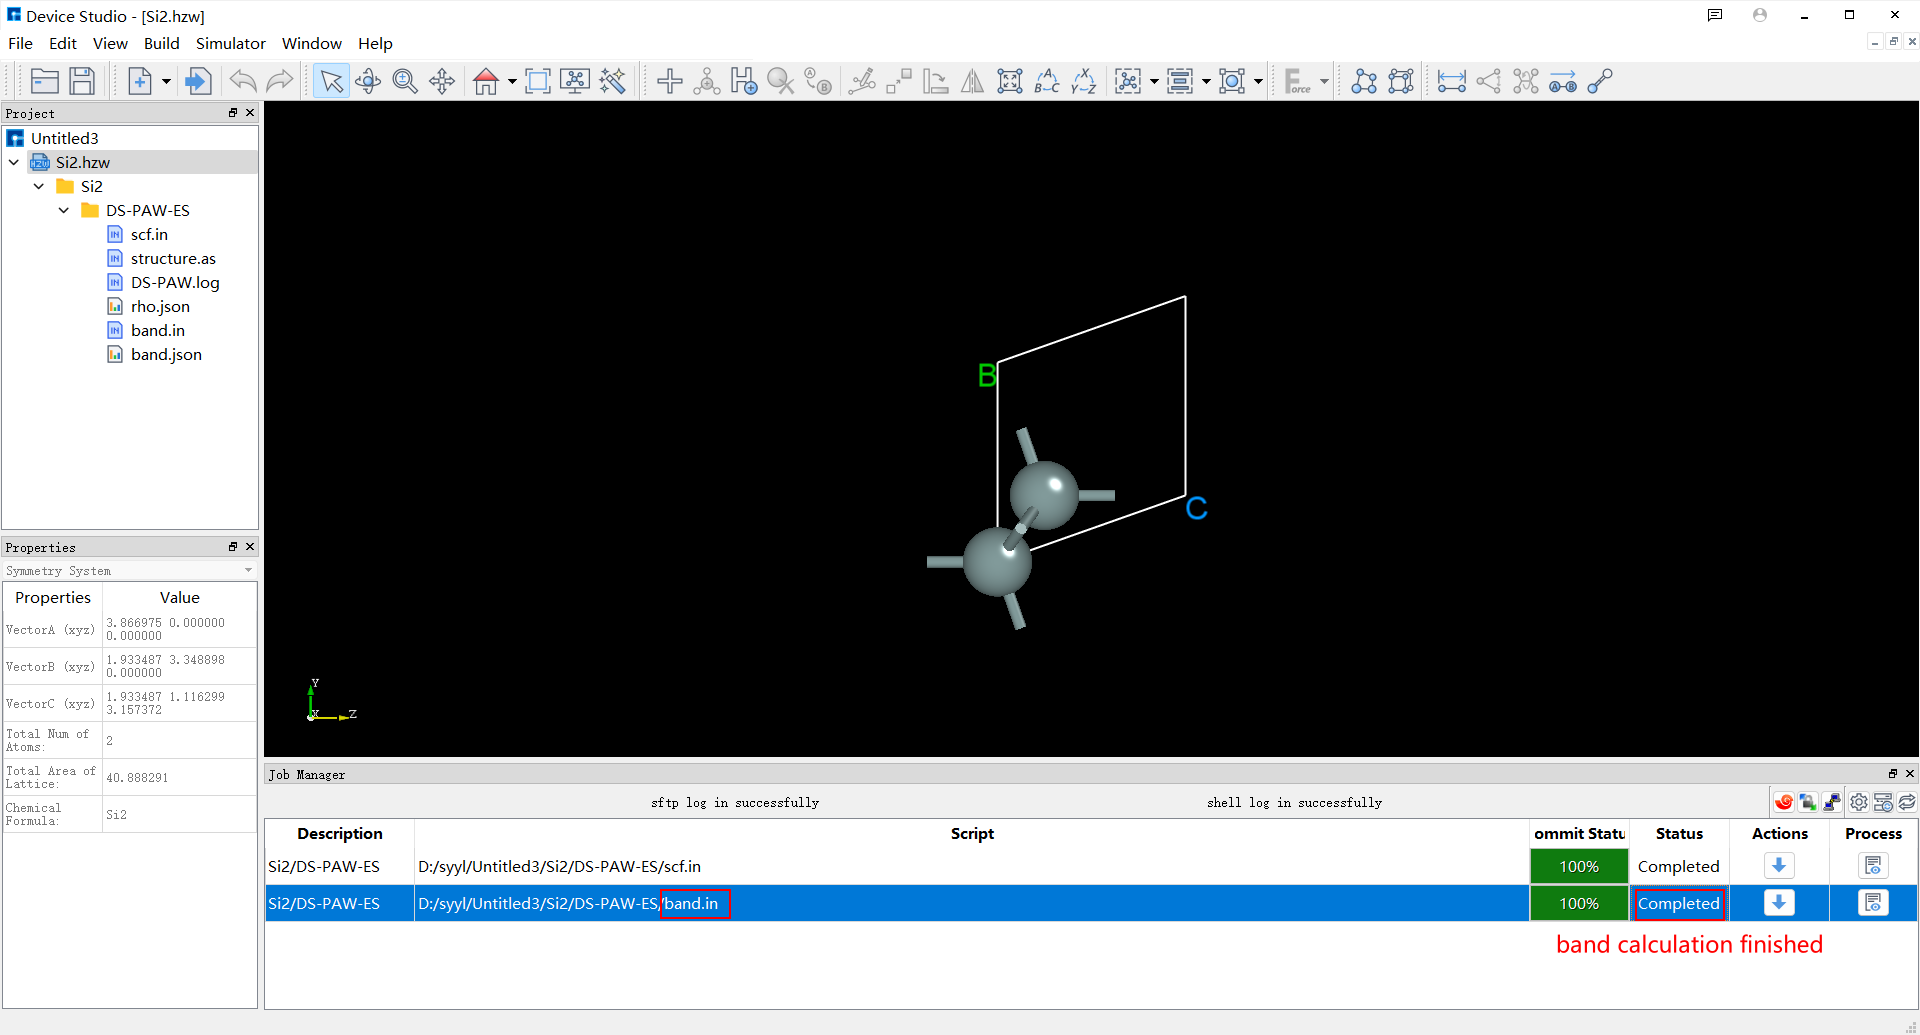
fig. 2.17 Device Studio Interface After Si Crystal Structure Band Structure Calculation Completion
After the Si crystal structure band structure calculation is completed, you can perform visualization analysis on the band structure calculation results. The process is shown in fig. 2.18.
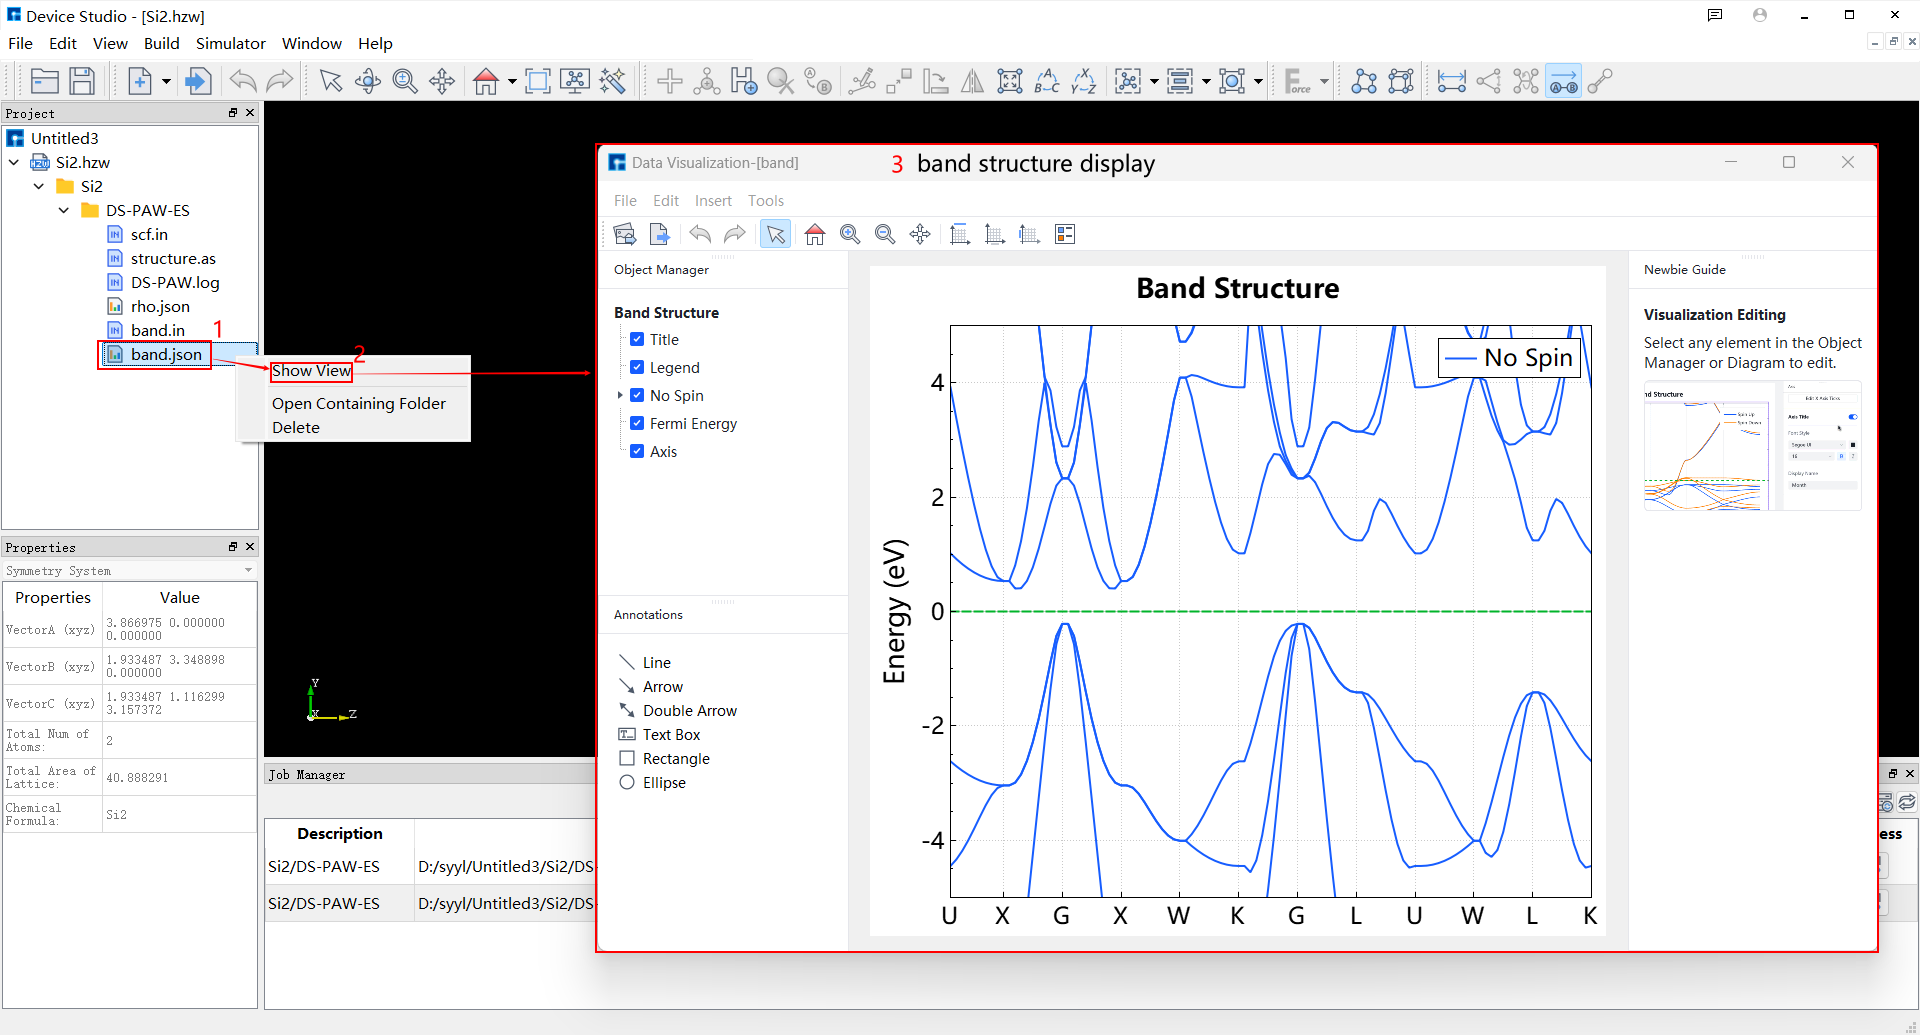
fig. 2.18 Device Studio Steps for Data Visualization of Si Crystal Structure Band Structure Calculation Results
After visualizing the Si crystal structure band structure calculation results, users can export the data visualization results as needed. The export process is shown in fig. 2.19.
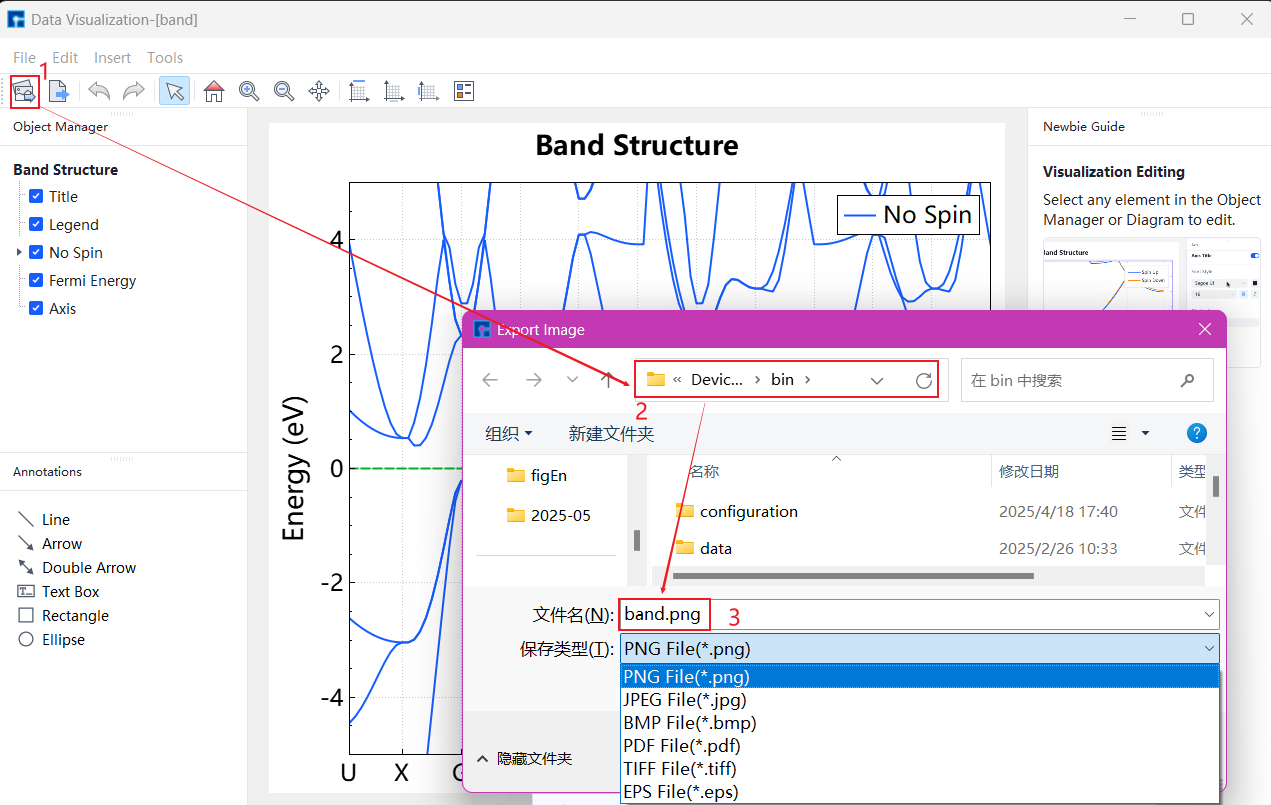
fig. 2.19 Device Studio Steps for Exporting Si Crystal Structure Band Structure Data Visualization Results